A network science story

The Bitcoin OTC Trust Network

Between 2010 and 2016, traders on Bitcoin OTC left 35,592 ratings about each other. This is the web of trust they built, and how reputation came to rest on a few accounts.

Scroll

Every dot is a trader

Each of these 5,551 dots is a user, and a line joins two users when either gave the other a positive rating. Linked users are pulled together by the layout; the position itself means nothing.

Shown: the largest connected part of the network. 308 users with no positive rating and 22 users in small separate pieces are left out.

A few hubs

Size now shows degree, the number of users someone is linked to. The average is

6.3 links

but user 35 has 788. Most users have one or two links and a handful have hundreds: the degree distribution is heavy-tailed.

Communities

Colours mark the five largest communities found by the Louvain method, which looks for groups with more links inside than random wiring would give. Their modularity is 0.504, against about 0.33 for random networks with the same degrees.

Built year by year

Keep scrolling to replay the record. Each link appears when its first positive rating was given, and red marks the newest. Most of the network was built in 2012 and 2013; by 2015 new ratings had slowed to a trickle.

Hubs link to small users

These are the 788 users linked to user 35. Most are small:

60%

have three links or fewer. Hubs connect mainly to users with few links rather than to each other. The network is disassortative, with an assortativity of \(r = -0.145\).

Random failures

Remove a random 15% of users. Blue users can still reach one another, and they are still

75% of users

Random losses barely hurt a network held together by hubs.

A targeted attack

Now remove the 15% of users with the most links. The network shatters, and its largest connected piece holds

under 1%

of users. The hubs are what hold the web of trust together.
Try it

Break the network yourself

Remove users and see what is left. Random failures take users at random; a targeted attack removes the most-connected users first. Blue users can still reach one another through the network; grey users have been cut off.

75%

of all 5,881 users are still in one connected piece.

random failures   targeted attack

The measures

A sparse small world

We turned the ratings into a network: users are nodes, and a positive rating from one user to another is a directed link. Most classic network models are for undirected networks, so we also join two users with one link when either rated the other, which gives 18,591 links among 5,881 users. These are its basic measures.

MeasureValueWhat it says
Average degree \(\langle k\rangle = 2L/N\)6.32Links per user; the largest hub has 788
Density \(2L/N(N-1)\)0.11%Very sparse: almost no pairs are linked
Average clustering \(\langle C\rangle\)0.155How often two neighbours of a user are also linked
Transitivity0.057Three times the triangles, divided by connected triples
Largest component94.4%Users who can reach each other
Mean distance \(\langle d\rangle\)3.76Links on a shortest path, inside the largest component
Diameter14The longest shortest path
Modularity0.504Strong community structure

Paths are shorter than in a random network of the same size, while clustering is about 150 times higher: together that is a small world. All five largest communities are weak communities in the sense of Barabási's Network Science, with more of their members' link ends inside the group than outside, although which users land in which group changes when the algorithm is rerun.

The models

What theory gets right, and wrong

We set the network beside three references: an Erdős–Rényi random network with the same users and links, a Barabási–Albert network grown by preferential attachment, and a degree-preserving randomization that keeps every user's degree but shuffles who is linked to whom.

ObservedERBARewired
Largest degree78817231788
Average clustering0.1550.0010.0080.061
Mean distance3.764.914.083.52
Modularity0.5040.3690.3880.334

Keeping the degrees reproduces the short paths but not the clustering or the communities. Those come from how users actually chose their partners.

Heavy-tailed, but not strictly scale-free

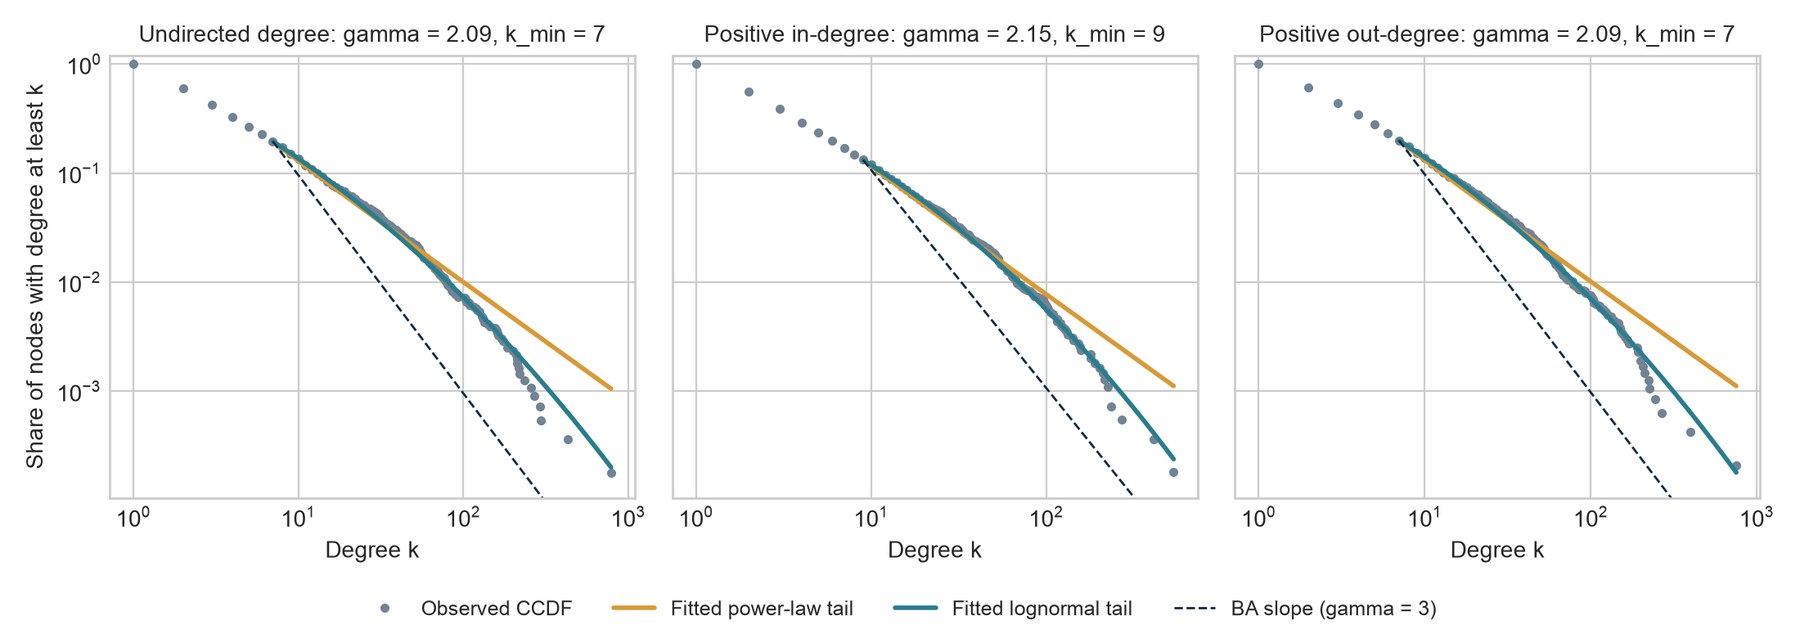
A scale-free network has a degree distribution \(P(k) \propto k^{-\gamma}\). Fitted properly, by maximum likelihood rather than a straight line on a log–log plot, the tail gives \(\gamma = 2.09\): heavier than the \(\gamma = 3\) of the BA model. Yet a lognormal tail fits better, and above about 100 links the data bend down.

BA's growth rule also fails, because 70.5% of links join two users who were already present. Barabási's internal-link model allows exactly that, and for the measured \(m = 0.99\) new and \(n = 2.35\) internal links per new user it predicts a value inside the fitted range:

\(\gamma = 2 + \dfrac{m}{m + 2n} = 2.17\)
Degree distributions on log-log axes with fitted power-law and lognormal tails and the BA slope
Degree distributions. Share of users with at least \(k\) links, for undirected, in- and out-degree, with the fitted tails and BA's slope.

Hubs and the structural cutoff

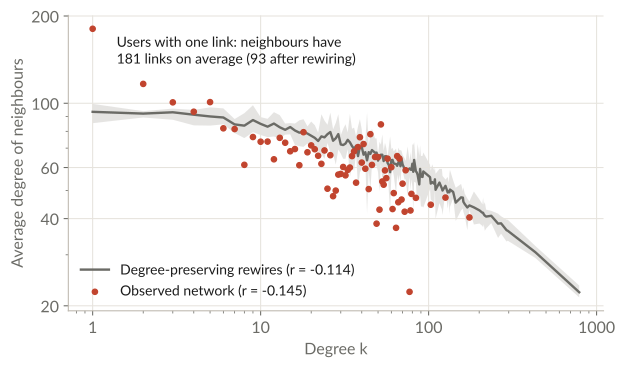
The negative assortativity is partly forced. In a simple network a hub cannot find enough other hubs to link to, and above the structural cutoff \(k_s = \sqrt{\langle k\rangle N} \approx 193\) that alone pushes \(r\) below zero. Randomizations that keep every degree already give \(r = -0.114\). The real network goes a little further: users with a single link are attached to neighbours with 181 links on average, against 93 after randomizing.

Average degree of a user's neighbours against the user's degree, for the observed network and for degree-preserving randomizations
Degree correlations. Average degree of a user's neighbours, \(k_{nn}(k)\), against the user's own degree.

The focused question

How reputation concentrated

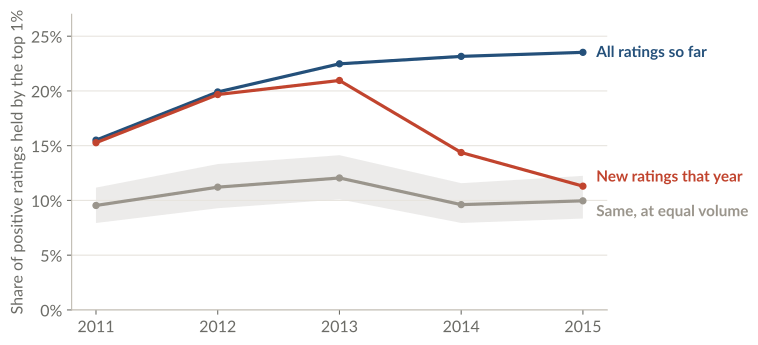
Counting all ratings received so far, the top 1% of users held 15.5% of positive ratings at the end of 2011 and 23.5% by 2015, and the rise also holds within the users present in 2011. The share of each year's new ratings seems to fall after 2013, but ratings collapsed from 11,138 to 929 a year. Redrawn to the same 743 ratings every year, 2013 and 2015 overlap: most of that fall is a volume effect.

Share of positive ratings held by the top 1% from 2011 to 2015, for all ratings so far, for each year's new ratings, and at equal volume
Concentration over time. The top 1% is chosen again at each date; the band shows the middle 95% of 1,000 equal-volume redraws.

Who receives the next rating?

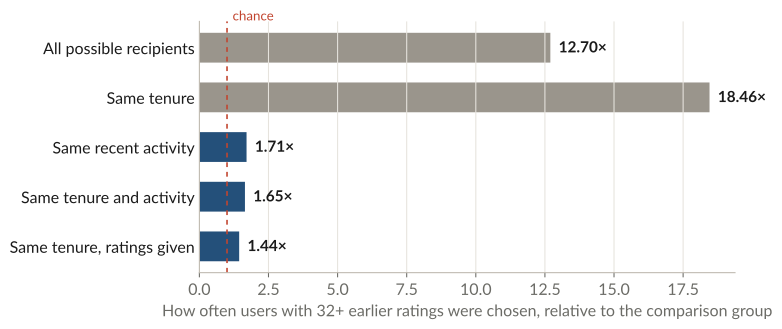
The standard way to measure preferential attachment from data (Barabási, Network Science, ch. 5) is to compare, for every new rating, the user who received it with everyone who could have. Users with 32 or more earlier ratings were chosen 12.7 times as often as chance, and the fitted rule \(\Pi(k) \propto k^{\alpha}\) has \(\alpha = 1.07\), almost exactly BA's linear attachment.

That compares a dormant newcomer with an active trader. Against users with the same tenure and recent activity the ratio falls to 1.65, and \(\alpha\) to a sublinear 0.68. Recent activity, not reputation, explains most of the advantage, and about half of all ratings simply return an earlier one, usually within minutes.

How often users with 32 or more earlier ratings were chosen, relative to five comparison groups
A fairer comparison. Users with 32 or more earlier ratings against everyone who could have been rated, and against users with the same tenure or recent activity.

Robustness

Robust to failures, fragile to attacks

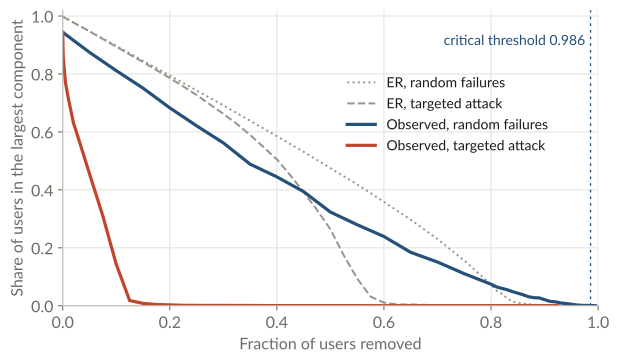
Percolation theory predicts when a network falls apart. A giant component exists while \(\kappa = \langle k^2\rangle / \langle k\rangle > 2\), the Molloy–Reed criterion, and removing a random fraction \(f\) of the users destroys it at the critical threshold

\(f_c = 1 - \dfrac{1}{\kappa - 1} = 0.986 \quad \text{for} \quad \kappa = 71.9\)

Random removal barely matters: the giant component survives until about 93% of users are gone. Removing the most-connected users first breaks it after 15%. Randomized networks with the same degrees break at the same point, so the hubs are the weak spot.

Share of users in the largest component as users are removed at random or by degree, for the observed network and an ER network
Percolation. The largest connected piece as users are removed at random or from the most connected down.

Drawn in Cytoscape

The most-rated users, close up

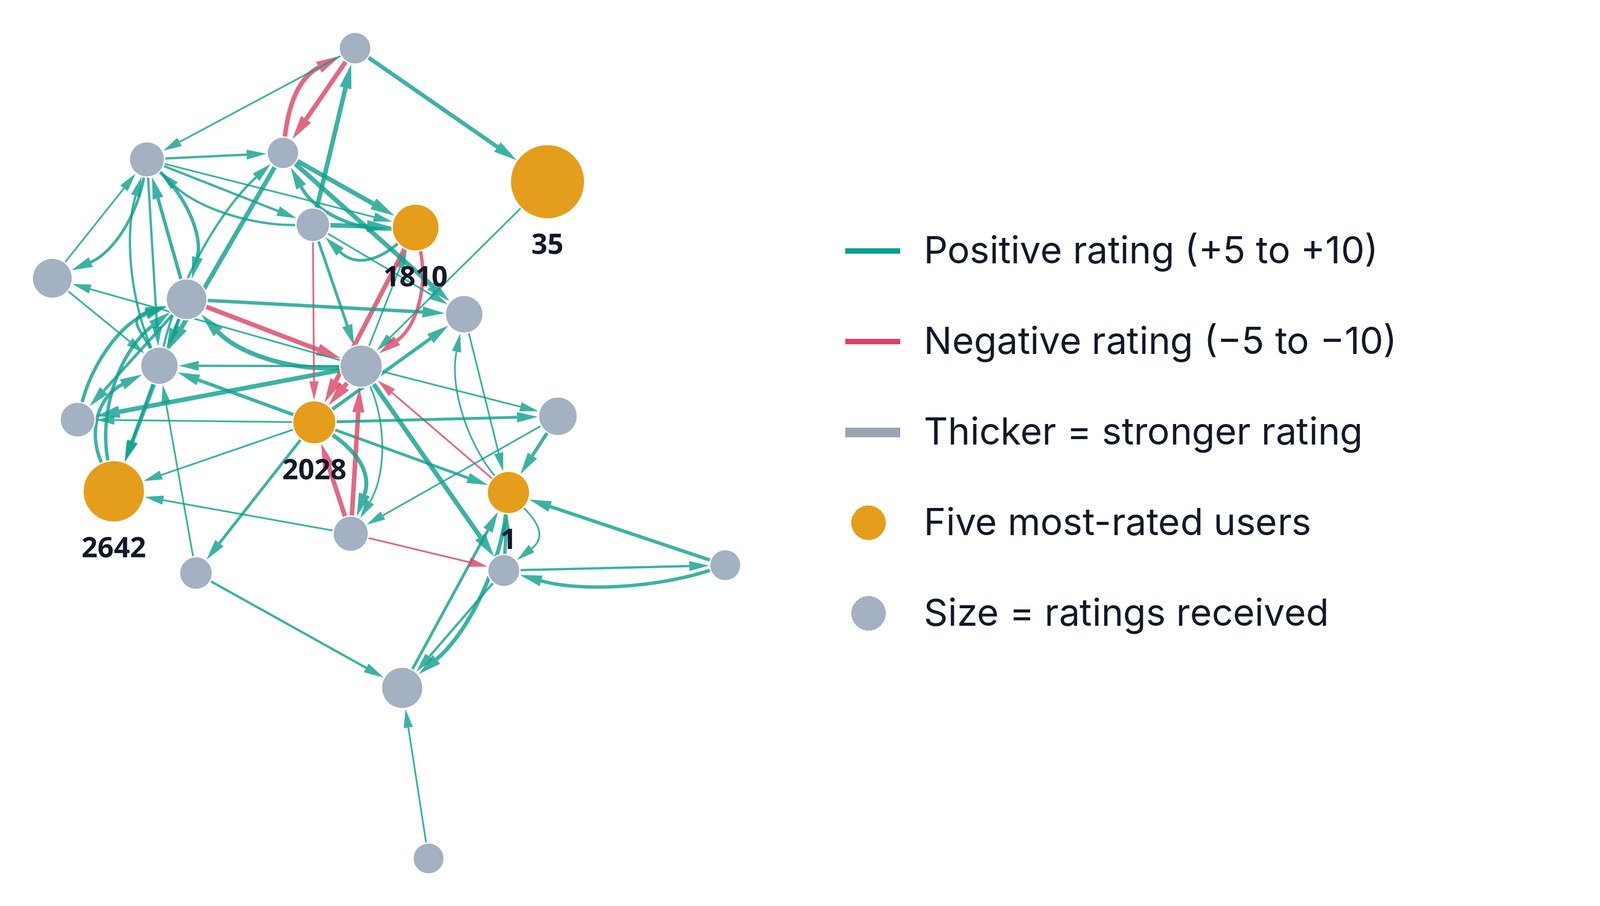
We also drew the 25 users with the most positive ratings and the strong ratings between them (±5 or more) in Cytoscape, and animated how those ratings appeared with CyAnimator. Three of the 25 have no strong rating with the others, so 22 are shown. Colour shows the sign of a rating, width its strength, and size how many ratings a user received.

Strong ratings among the most-rated users, drawn in Cytoscape
Cytoscape. All 76 strong ratings among the 22 users. Watch the CyAnimator animation on slide 9 of the presentation below.

What it means

Lessons for a web of trust

Reputation stays concentrated. By 2015, 56 accounts held 23.5% of positive ratings. Ratings never expire here, so a high score can describe the past more than the present.

A few accounts hold it together. Losing or compromising a handful of hubs would disconnect far more of the trust record than the same number of random departures.

Counts overstate independent opinions. About half of the ratings return an earlier one, often within minutes, so a rating count is not a count of independent endorsements.

Activity beats reputation. Recent activity explains most of the pull of highly rated users. We cannot separate it from trading volume, which the data do not record.

The talk

The presentation

The fifteen slides of our thirteen-minute talk. Use the arrows, the arrow keys, or swipe; slide 9 plays the CyAnimator video. The arrow button (or a double click on a slide) shows them full screen.

Slide 1: The Bitcoin OTC Trust Network
1 / 15 The Bitcoin OTC Trust Network

Reproduce

Every number can be rebuilt

The repository has the analysis scripts, notebooks that work through each method by hand, the stored results, and a checker that compares a new run with the recorded one. With Python 3.12:

# set up the environment
python3.12 -m venv .venv
.venv/bin/python -m pip install -r requirements.txt
# put soc-sign-bitcoinotc.csv.gz from SNAP in data/, then
.venv/bin/python scripts/reproduce.py
.venv/bin/python scripts/verify_reproduction.py --check-manifest

See also the code walkthrough and the Cytoscape workflow.