Looking Further Ahead
The Polish dataset comes in five versions. One records whether a company failed within a year of the accounts being filed; another within two years, and so on out to five. That gives a free second question: does a borrowed model get worse the further ahead you ask it to look?
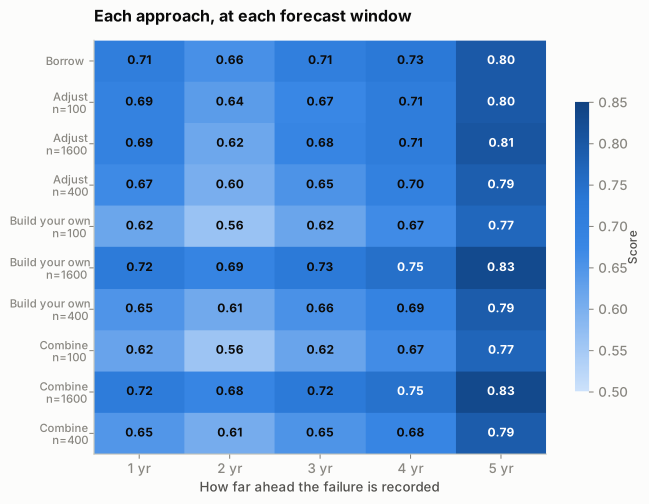
How to read it. Each row is one approach: borrowing the Taiwanese model outright, or one of the three that use Polish records, shown at 100, 400 and 1,600 records. Each column is how far ahead the failure is being predicted. Darker means a better score.
The top row is the borrowed model. Read down any column to see which approaches beat it in that forecast window — and note that in most columns you have to go a long way down before anything does.
Looking further ahead scores better here — and that’s a trap
Common sense says predicting five years out should be harder than predicting one. In this data the scores go the other way, and the reason has nothing to do with forecasting skill.
| Looking ahead | Companies | Share that failed | Borrowed model | Built in Poland | Cost of borrowing |
|---|---|---|---|---|---|
| 1 year | 7027 | 3.9% | 0.711 | 0.764 | 0.053 |
| 2 years | 10173 | 3.9% | 0.66 | 0.775 | 0.115 |
| 3 years | 10503 | 4.7% | 0.705 | 0.797 | 0.092 |
| 4 years | 9792 | 5.3% | 0.724 | 0.801 | 0.077 |
| 5 years | 5910 | 6.9% | 0.794 | 0.859 | 0.065 |
Look at the third column. Over one year, 3.9% of the companies failed. Over five years, 6.9% did — because a company has five years in which to go under rather than one.
More failures means more examples to learn from, so every approach scores higher on the longer windows. That is a property of how the dataset was built, not evidence that five-year forecasting is easier than one-year forecasting. Comparing across the rows of that table compares different failure rates as much as different forecast windows.
What does hold steady is the cost of borrowing
The last column is the one worth reading. Whatever window you pick, borrowing a model instead of building one costs roughly the same: between 0.05 and 0.12, with no trend as the window lengthens.
Borrowing costs about the same amount of accuracy no matter how far ahead you’re forecasting. The penalty doesn’t compound with distance.
The one place the answer shifts is the five-year window, where building your own overtakes borrowing at around 800 records instead of 1,600. That’s the same base-rate effect again: with nearly twice the failure rate, the same number of records buys you nearly twice as many actual bankruptcies to learn from.
Next: what all this means.