Cross-Market Credit Risk Transfer
Can a model that spots failing companies in one country work in another?
The problem
A bank wants to know which of its business customers are heading for bankruptcy, so it can stop lending to them in time. To learn that pattern, a computer model needs examples: companies that did go under, and companies that didn’t.
Now the bank expands into a new country. It can get the financial accounts of companies there. What it cannot get is a record of which ones failed — it has only just arrived. There is nothing to learn from.
The common workaround is to borrow: take the model built back home and point it at the new country. It gets done all the time, and it rarely gets checked, for a circular reason. Checking it needs exactly the failure records whose absence caused the problem.
So I checked it. I built a model on Taiwanese companies, where the outcomes are on record, and used it to score Polish companies. I looked at what actually happened to those Polish firms only afterwards, to mark the model’s homework.
Borrowing worked — but only after fixing a problem that had nothing to do with the model. And the borrowed model kept beating one built from local records until the bank had gathered around 1,600 of them.
How to read those scores. They measure how well a model sorts companies by risk. Pick one company that failed and one that survived, at random: the score is the chance the model rated the failing one as riskier. 0.5 means pure guesswork. 1.0 means perfect.
The two datasets
Both are free, public, and record what actually happened to every company. That last part is what makes the test possible at all — I can hide the Polish outcomes, let the model guess, then check the answers.
| Country | Failure recorded | Companies | Failed | Share that failed |
|---|---|---|---|---|
| Taiwan | — | 6819 | 220 | 3.2% |
| Poland | within 1 year | 7027 | 271 | 3.9% |
| Poland | within 2 years | 10173 | 400 | 3.9% |
| Poland | within 3 years | 10503 | 495 | 4.7% |
| Poland | within 4 years | 9792 | 515 | 5.3% |
| Poland | within 5 years | 5910 | 410 | 6.9% |
Each company is described by financial ratios — simple divisions taken from its accounts. Debts divided by assets, for instance: a company owing more than it owns is in trouble, and that ratio says so in one number.
The catch is that the two files don’t describe companies the same way. Taiwan lists 95 ratios with proper names. Poland lists 64 with the names stripped out — they are called only Attr1 through Attr64, and you have to read the documentation to find out what each one is. Getting them onto common ground was the first real job, and it is where the interesting problem turned up: matching the columns.
What happened
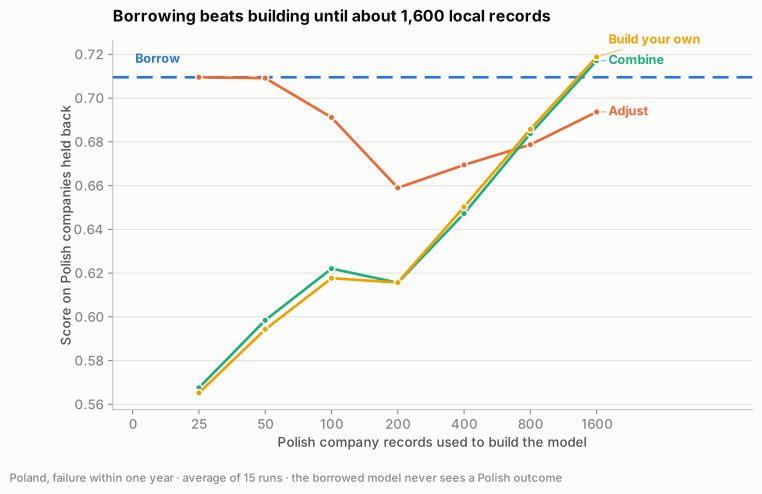
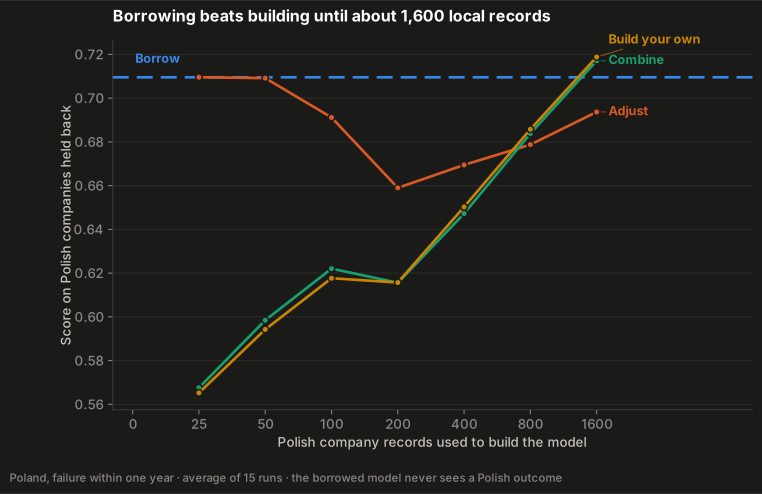
The flat line is the borrowed Taiwanese model. It never sees a single Polish outcome, so it never improves — it just sits there. The rising lines are models built from Polish records. They start off much worse and only catch up right at the end, at around 1,600 companies.
That number is the practical finding. Only about 4% of companies fail, so 1,600 records means waiting for roughly 60 actual bankruptcies to accumulate. That is years of history. Until then the borrowed model is the better tool — and it is available on day one.
Four things I found
The first attempt failed completely, and the model was not the problem. Used exactly as it came, the borrowed model scored 0.49 — a coin flip. The cause turned out to be bookkeeping. Whoever published the Taiwanese file had squashed every number into a range from 0 to 1 before releasing it. The Polish file kept its original figures. So a “0.5” meant one thing in one file and something completely different in the other, and the model was comparing quantities that were never comparable.
The fix was to stop comparing raw numbers at all. Instead, compare each company to other companies in its own country: “this firm carries more debt than 80% of the firms around it”. That sentence means the same thing in Taipei and in Warsaw, whatever units the original file happened to use. Nothing was retrained. The score went from 0.49 to between 0.66 and 0.79.
What warns you about a failing company is mostly the same in both countries. How much it owes, whether it makes a profit, and whether it can pay this month’s bills all point the same way in Taiwan and in Poland. Debt level was the strongest single warning sign in both.
Four ratios pointed opposite ways, which looks alarming until you check how strong they were: all four scored between 0.46 and 0.58 — barely better than guessing — in both countries. They were near-useless everywhere, so the direction they pointed was mostly noise. All four measure operating speed, like how quickly a company collects money it is owed. That turns out to say very little about whether it survives.
The sophisticated model was only worth it at home. I compared a modern, flexible model using all 17 shared ratios against a simple one using just five ratios an accountant singled out in 1968. Working inside Poland, the modern model won clearly. Sent across the border, its lead almost vanished and the 1968 shortlist came within a hair of it. The flexible model had learned quirks specific to Polish companies, and those quirks do not exist in Taiwan.
Half-measures were the worst option. I tried three ways of blending the borrowed model with a small amount of Polish data. None beat simply using the borrowed model untouched. Feeding it a little local data made it worse in 14 attempts out of 15 — too little to learn anything real, but enough to pull it off course. Borrow the whole model, or wait until you can build your own. The middle ground lost.
What this does not show
The Taiwanese companies are stock-market listed. The Polish ones are mostly private. Listed companies are larger and must publish more. So when the model does worse abroad, I cannot tell whether that is because the country changed or because the kind of company changed — both moved at the same time. This setup cannot separate them, and I am not claiming it does.
The fix described above also throws something away. Ranking a company against its neighbours loses the absolute figure, and “this company owes more than it owns” is a genuinely meaningful line to cross, not merely a high position in a queue.
More on both in Takeaways.
Run it yourself
Everything here can be rebuilt from scratch. You need Python and Quarto.
python -m venv .venv
.venv\Scripts\activate          # Mac or Linux: source .venv/bin/activate
pip install -e ".[dev]"

python scripts/fetch_data.py    # downloads the two datasets, about 20 MB
python -m cmfdt.pipeline        # does the number-crunching, about 3 minutes
python -m cmfdt.plotting        # draws the charts
pytest                          # runs the checks
quarto render site              # rebuilds this website
Activate the workspace first, as the second line does. Otherwise the last step can pick up a different Python from elsewhere on your machine and fail.
The datasets are not stored in this repository. The download step fetches them from the university archive that publishes them. Every number and chart on this site is produced by those commands and read back from a file — none of it is typed in by hand.